9 charts illustrate the current state of climate change.
- The Intergovernmental Panel on Climate Change published a report on Monday that contained several charts depicting the impact of climate change.
- Between 2010 and 2019, the growth rate of anthropogenic emissions was slower compared to the period between 2000 and 2009.
- Despite the decline in the cost of renewable energy and batteries for electric vehicles, global climate policies are not doing enough to reduce greenhouse gas emissions to prevent global warming from exceeding 1.5° Celsius.
Climate change is not the result of a single individual's actions and cannot be resolved by a single solution. Instead, it is caused by a complex set of issues and requires a multifaceted approach to address.
Despite substantial advancements worldwide in reducing greenhouse gas emissions and mitigating global warming, it remains insufficient.
The Intergovernmental Panel on Climate Change report, published Monday, includes charts to visually convey the complex story told in the report.
The consequences of inaction are dire and clear, although the mix of factors and solutions are incremental.
The UN Secretary General, António Guterres, stated on Monday that we are heading towards a climate disaster with major cities submerged, unprecedented heatwaves, terrifying storms, and widespread water shortages, which will lead to the extinction of a million species of plants and animals. This is not a work of fiction or an exaggeration; it is the scientific prediction of the consequences of our current energy policies.
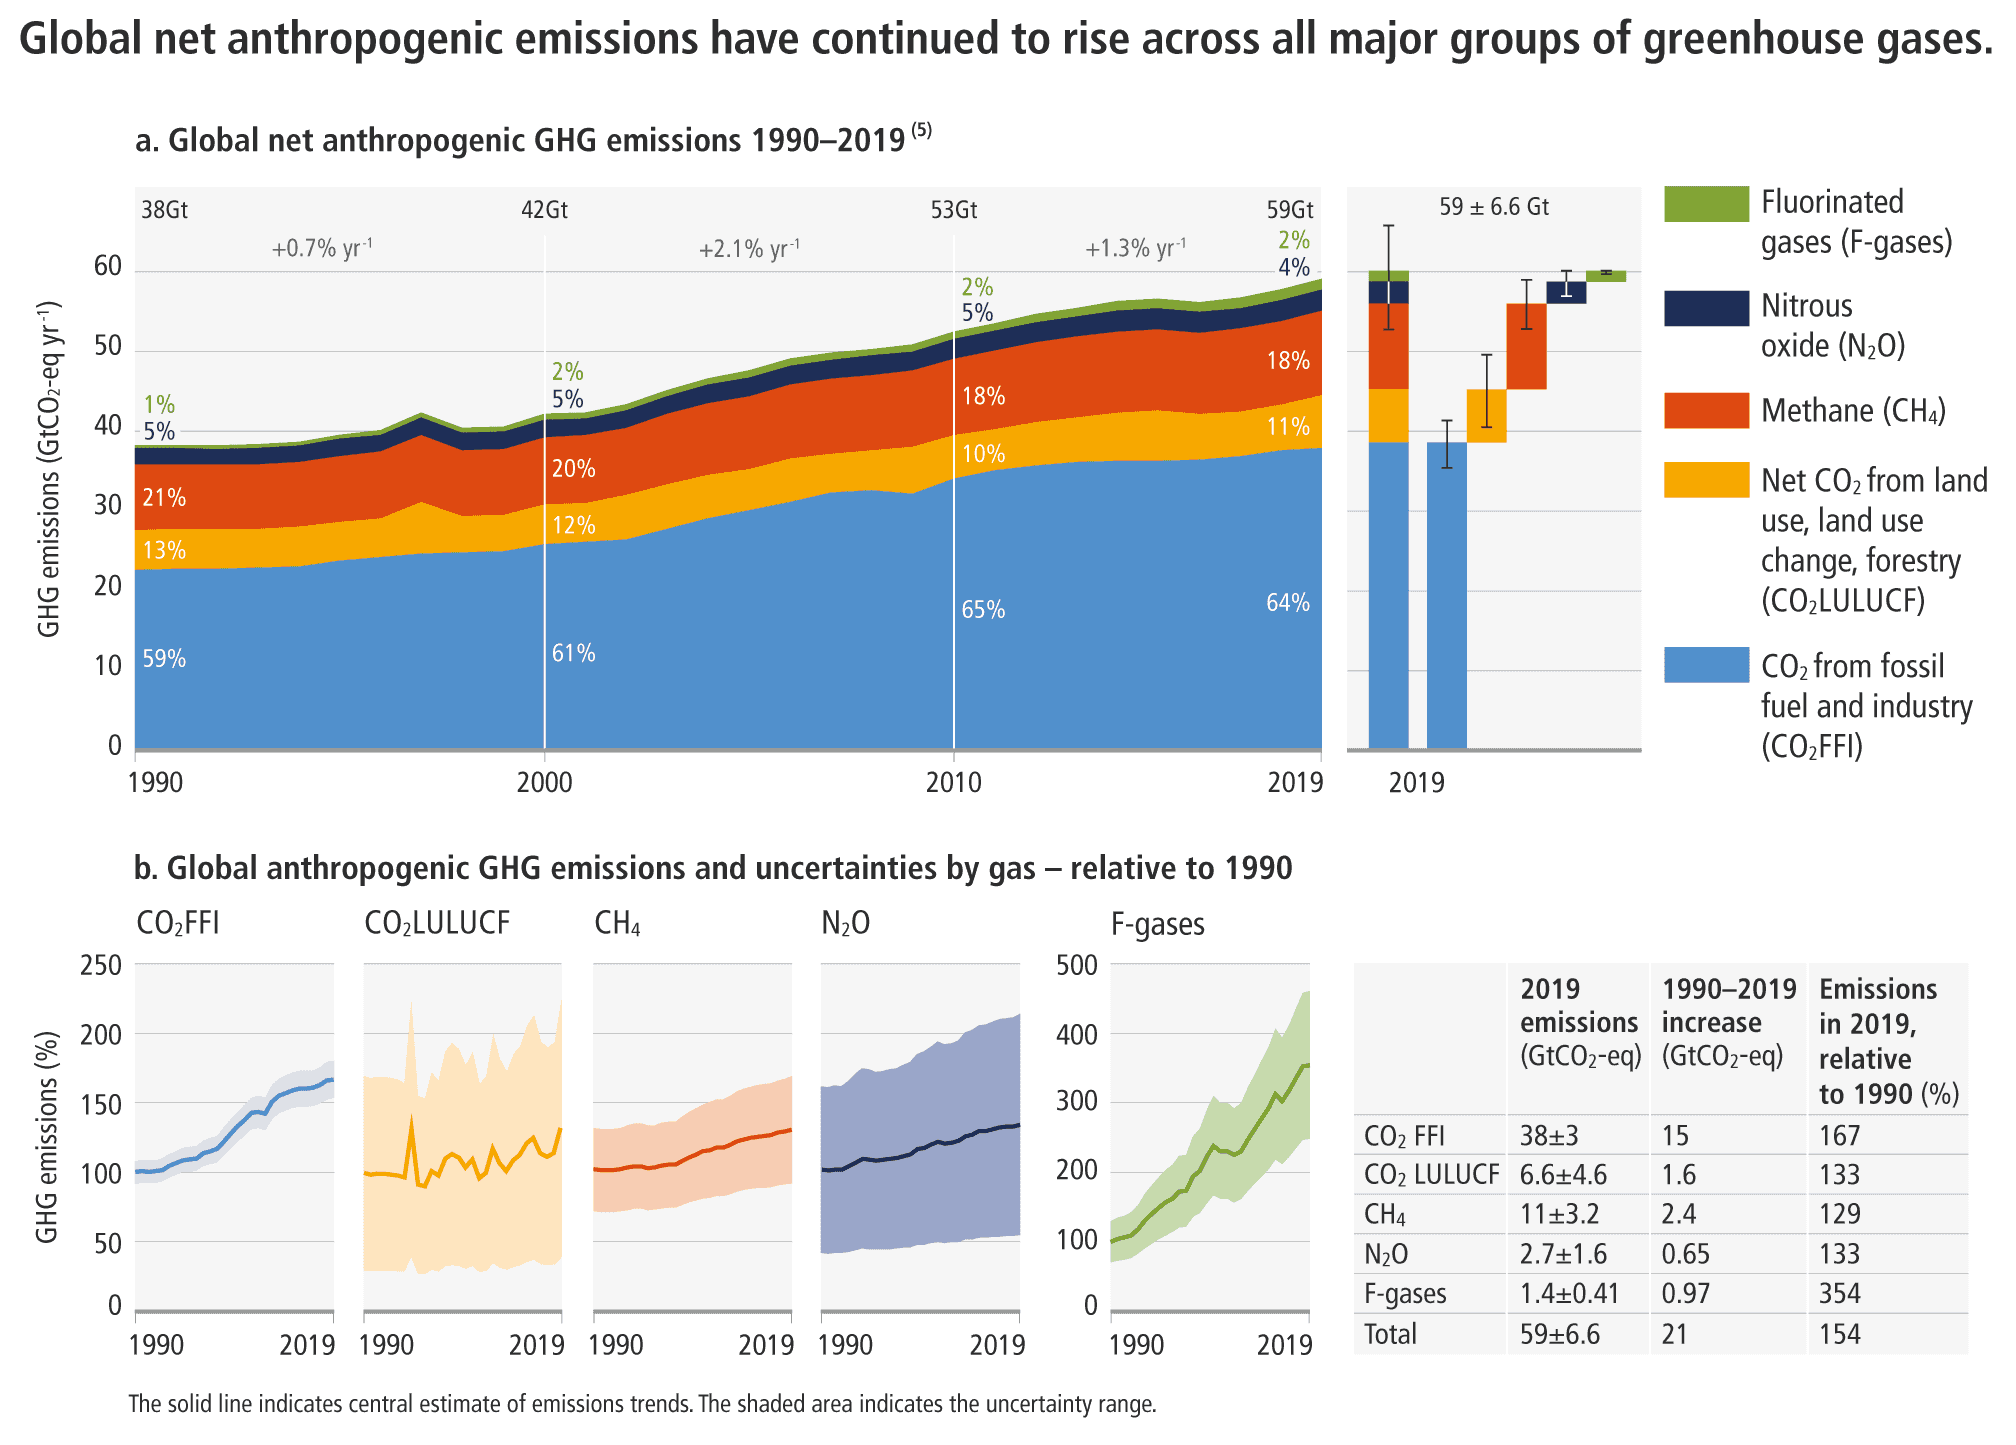
Greenhouse gas emissions caused by humans have increased
The issue with climate change is that human behavior has led to an increase in greenhouse gas emissions, and although some reductions have been made through efficiency improvements, these have been outpaced by the growth of global activity.
To achieve the goal of limiting global warming to 1.5° Celsius above preindustrial levels, established by the 2015 Paris Climate Agreement, greenhouse gas emissions must peak before 2025 and be reduced by 43% by 2030, according to IPCC scenarios.
Guterres stated on Monday that the current climate pledges would result in a 14% increase in emissions. Furthermore, most major emitters are not taking the necessary steps to fulfill their inadequate promises.
Between 2010 and 2019, the rate of growth of greenhouse gas emissions was lower than between 2000 and 2009.
Emissions by geography
Greenhouse gas emissions have overwhelmingly come from more developed countries and wealthier individuals.
The IPCC Working Group III Co-Chair, Jim Skea, stated in a written report that climate change is a result of unsustainable energy and land use, lifestyles, and consumption and production patterns for over a century. He emphasized that taking action now can lead to a fairer and more sustainable world.
The cost of renewable energy has plunged
The decline in the cost of renewable energy technologies, including wind and solar, has led to an increase in their adoption in recent decades.
Guterres stated on Monday that the shift to renewable energy must triple in order to respond to the report, as renewables are already cheaper in most cases.
To reduce their reliance on Russian energy due to the war in Ukraine, countries worldwide have been urged by leaders, including U.S. Secretary of Energy Jennifer Granholm, to boost domestic oil and gas production.
The U.N. secretary general opposed a temporary rise in oil and gas output, despite his initial approval.
The war in Ukraine is driving up food and energy prices, and inflation is also on the rise. However, increasing fossil fuel production will only exacerbate the problem, according to Guterres, who made the statement on Monday. The choices made by countries now will determine whether they uphold their commitment to 1.5 degrees.
Current climate action is insufficient
The current global response to climate change is insufficient.
If the nationally determined contributions announced before COP26 are implemented, global warming will not be limited by the reduction in greenhouse gas emissions.
The chart above displays the current trend of implemented policies in red, while the light blue and green lines represent the greenhouse gas emissions required to limit global warming to 1.5° Celsius and 2° Celsius, respectively. Both of these trend lines fall below the red trend line, indicating the current trajectory of the globe.
More aggressive reductions will limit warming
The extent of global warming (as depicted on the right) is contingent on the degree to which emissions are reduced.
A less aggressive emissions reduction policy (C8, the dark red color) will result in the most global warming.
Pathways that limit global warming to 1.5 or 2 degrees Celsius require immediate action
The chart depicts GHG emissions, specifically CO2, CH4, and N2O, under various potential scenarios, which the IPCC refers to as illustrative mitigation emissions pathways (IMPs).
If current policies and pledges are carried forward, the projected emissions pathways will be in the red-shaded ranges. However, if more aggressive policies that limit global warming to 1.5°C are implemented, the emissions pathways will be in the blue-shaded range.
If we want to keep global warming below 1.5°C (2.7°F), we must act now and make significant reductions in emissions across all sectors, according to Skea in a statement.
Where emissions come from
The chart illustrates the sources of carbon dioxide emissions and the various routes to achieving net zero emissions.
A cost-benefit analysis of mitigation options
Each technology has a different potential to reduce net greenhouse gas emissions, as shown in the chart above.
Consumer behavior changes can lower demand
The IPCC has identified three types of change that can help reduce emissions: socio-cultural factors, infrastructure use, and end-use technology adoption. Socio-cultural factors involve behavioral choices made by individuals, while infrastructure use refers to changes in the design of infrastructure that enable individuals to make different choices. End-use technology adoption involves changes in the uptake of technologies by end users.
By implementing the appropriate policies, infrastructure, and technology, we can achieve a 40-70% reduction in greenhouse gas emissions by 2050, according to IPCC Working Group III Co-Chair Priyadarshi Shukla. This presents a significant opportunity for improvement in our lifestyles and behavior, as well as our health and wellbeing.
Cities that allow for walking or short travel distances enable individuals to reduce their carbon footprint.
"Buildings must become more efficient in order to capture the mitigation potential of buildings," said Skea.

business-news


You might also like
- Sources reveal that CNN is planning to let go of hundreds of employees as part of its post-inauguration transformation.
- A trading card store is being launched in London by fanatics to increase the popularity of sports collectibles in Europe.
- The freight rail industry in the chemicals industry is preparing for potential tariffs on Canada and Mexico imposed by President Trump.
- Stellantis chairman outlines planned U.S. investments for Jeep, Ram to Trump.
- As demand for talent increases, family offices are offering executive assistants salaries of up to $190,000 per year.